Grafana Cloud
Grafana Cloud is a fully managed observability platform that supports OpenTelemetry. Follow these steps to set up Gate with Grafana Cloud:
Create a Grafana Cloud Account
- Sign up at Grafana.com
- Navigate to your organization
- Create an Access Policy with write permissions at Access Policies
- Generate and save your API token
Configure Stack
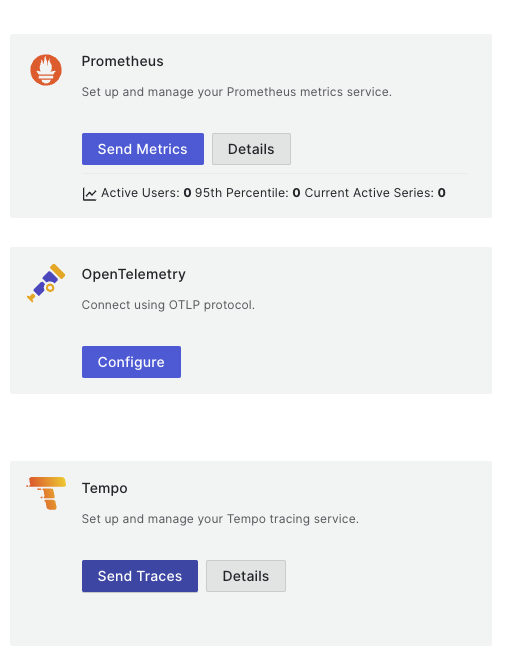
Navigate to your Grafana Cloud Stack (e.g., grafana.com/orgs/your-org/stacks/xxxxx) and:
- Click "Send Traces" in the Tempo section to get your traces endpoint
- Click "Send Metrics" in the Prometheus section to get your metrics endpoint
Prepare Your Authentication
You'll need to encode your credentials in base64 format. Use one of these methods:
Using the command line:
bashecho "YOUR_INSTANCE_ID:YOUR_API_TOKEN" | base64Or visit an online base64 encoder like base64encode.org
Configure Gate
Export the following environment variables before starting Gate:
bash# For traces (Tempo) export OTEL_EXPORTER_OTLP_ENDPOINT="https://tempo-prod-XX-prod-XX-XXXXX.grafana.net/tempo" export OTEL_EXPORTER_OTLP_HEADERS="Authorization=Basic YOUR_BASE64_ENCODED_CREDENTIALS" # For metrics (Prometheus) export OTEL_EXPORTER_OTLP_PROTOCOL="http/protobuf" export OTEL_METRICS_EXPORTER="otlp" export OTEL_EXPORTER_OTLP_METRICS_ENDPOINT="https://prometheus-prod-XX-prod-XX-XXXXX.grafana.net/api/prom/push" export OTEL_EXPORTER_OTLP_METRICS_HEADERS="Authorization=Basic YOUR_BASE64_ENCODED_CREDENTIALS"TIP
For production deployments, consider setting these environment variables in your system configuration or container orchestration platform rather than exporting them manually.
Start Gate
Once the environment variables are set, start Gate normally. It will automatically begin sending telemetry data to Grafana Cloud.
bashgateSee Install for more information on how to start Gate.
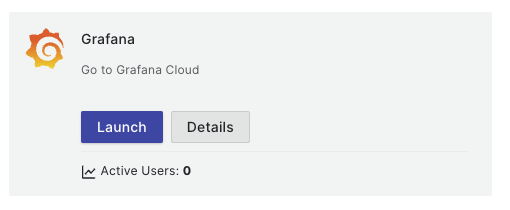
View Your Data
Log into your Grafana Cloud account and click on the "Launch" button for Grafana:
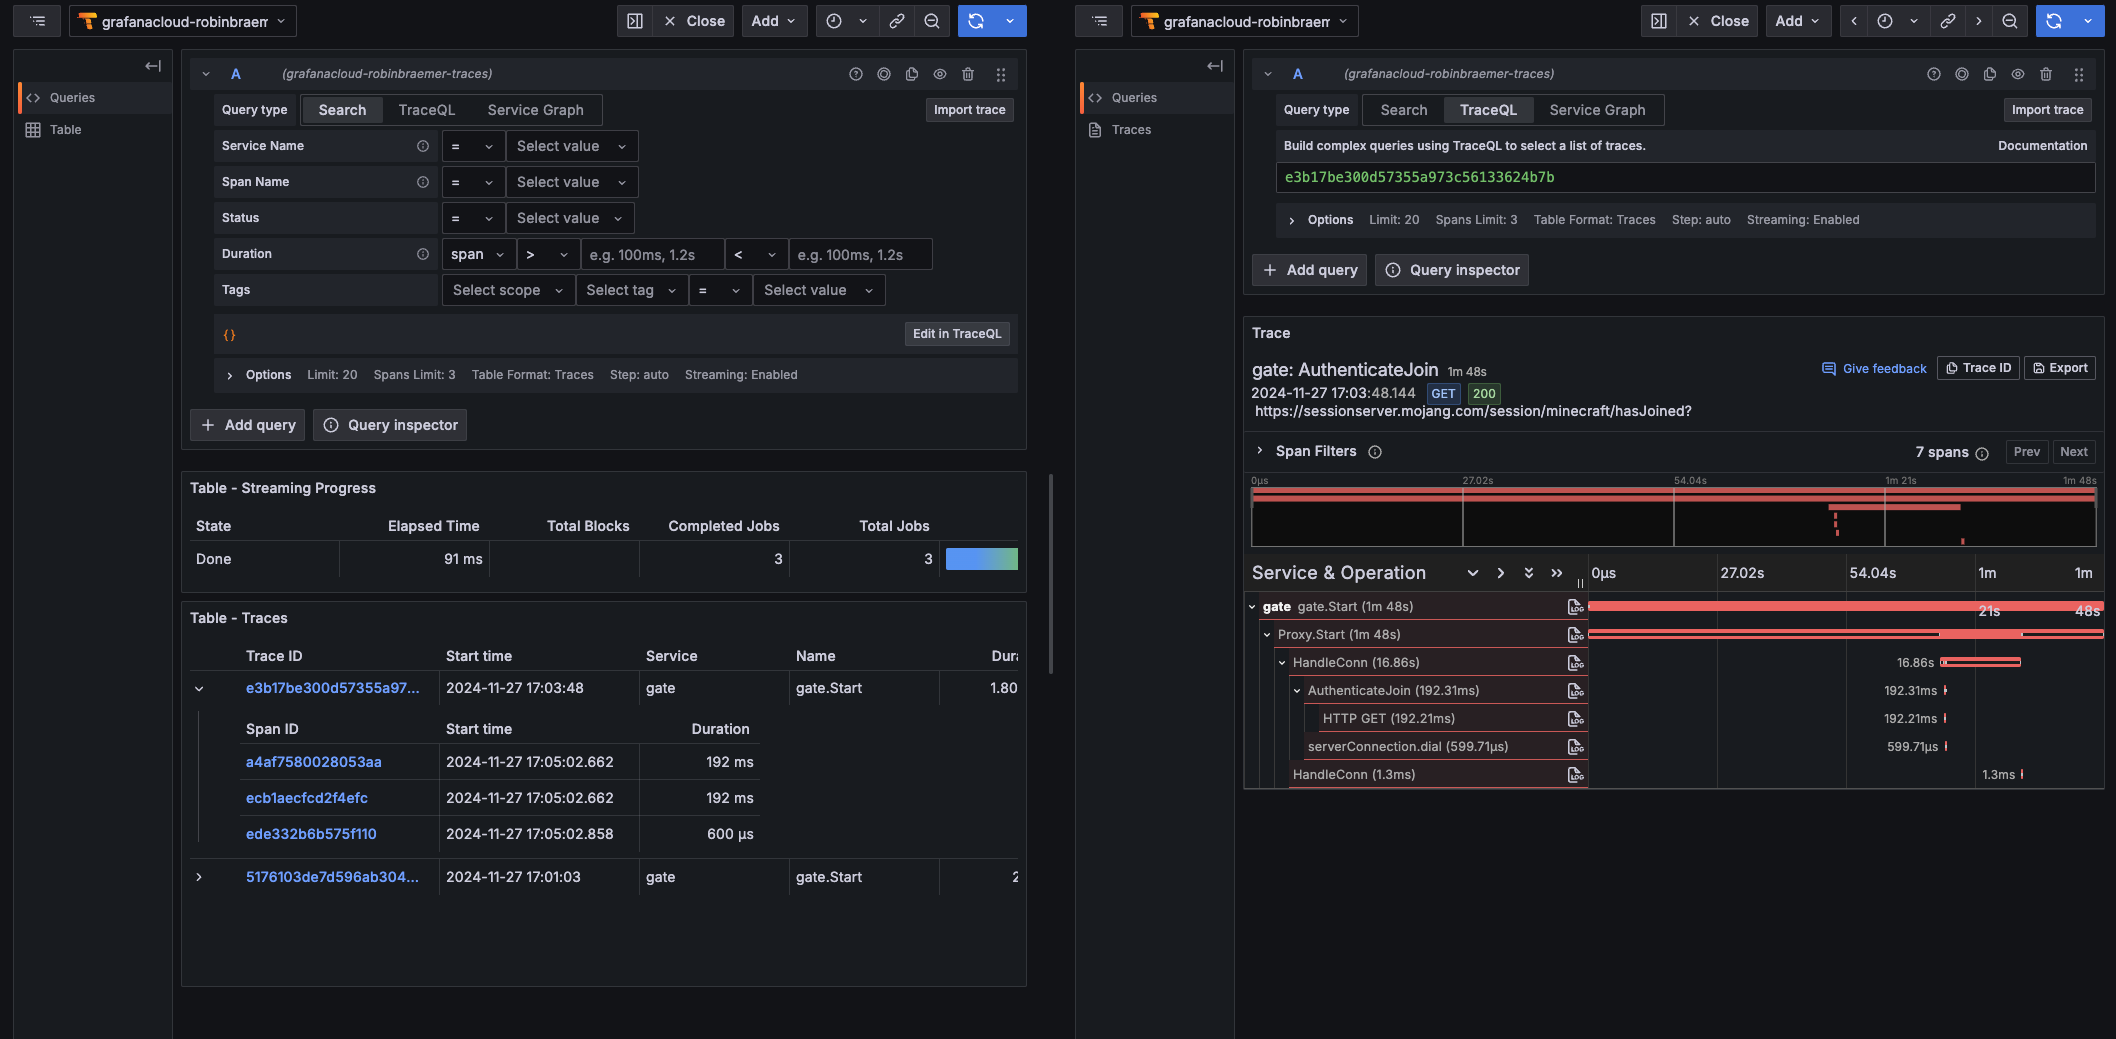
- Navigate to the Tempo service to view your traces
- Navigate to the Prometheus service to view your metrics
- Go to the "Explore" section and select "Tempo" to in the sources
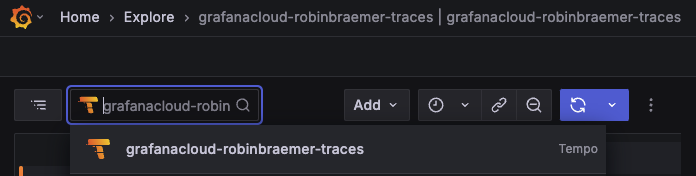
- Or select "Prometheus" to view your metrics