Sample Gate Dashboard
We provide a sample Grafana dashboard to help you get started with visualizing Gate's metrics.
You are expected to make your own dashboard, this is just a starting point.
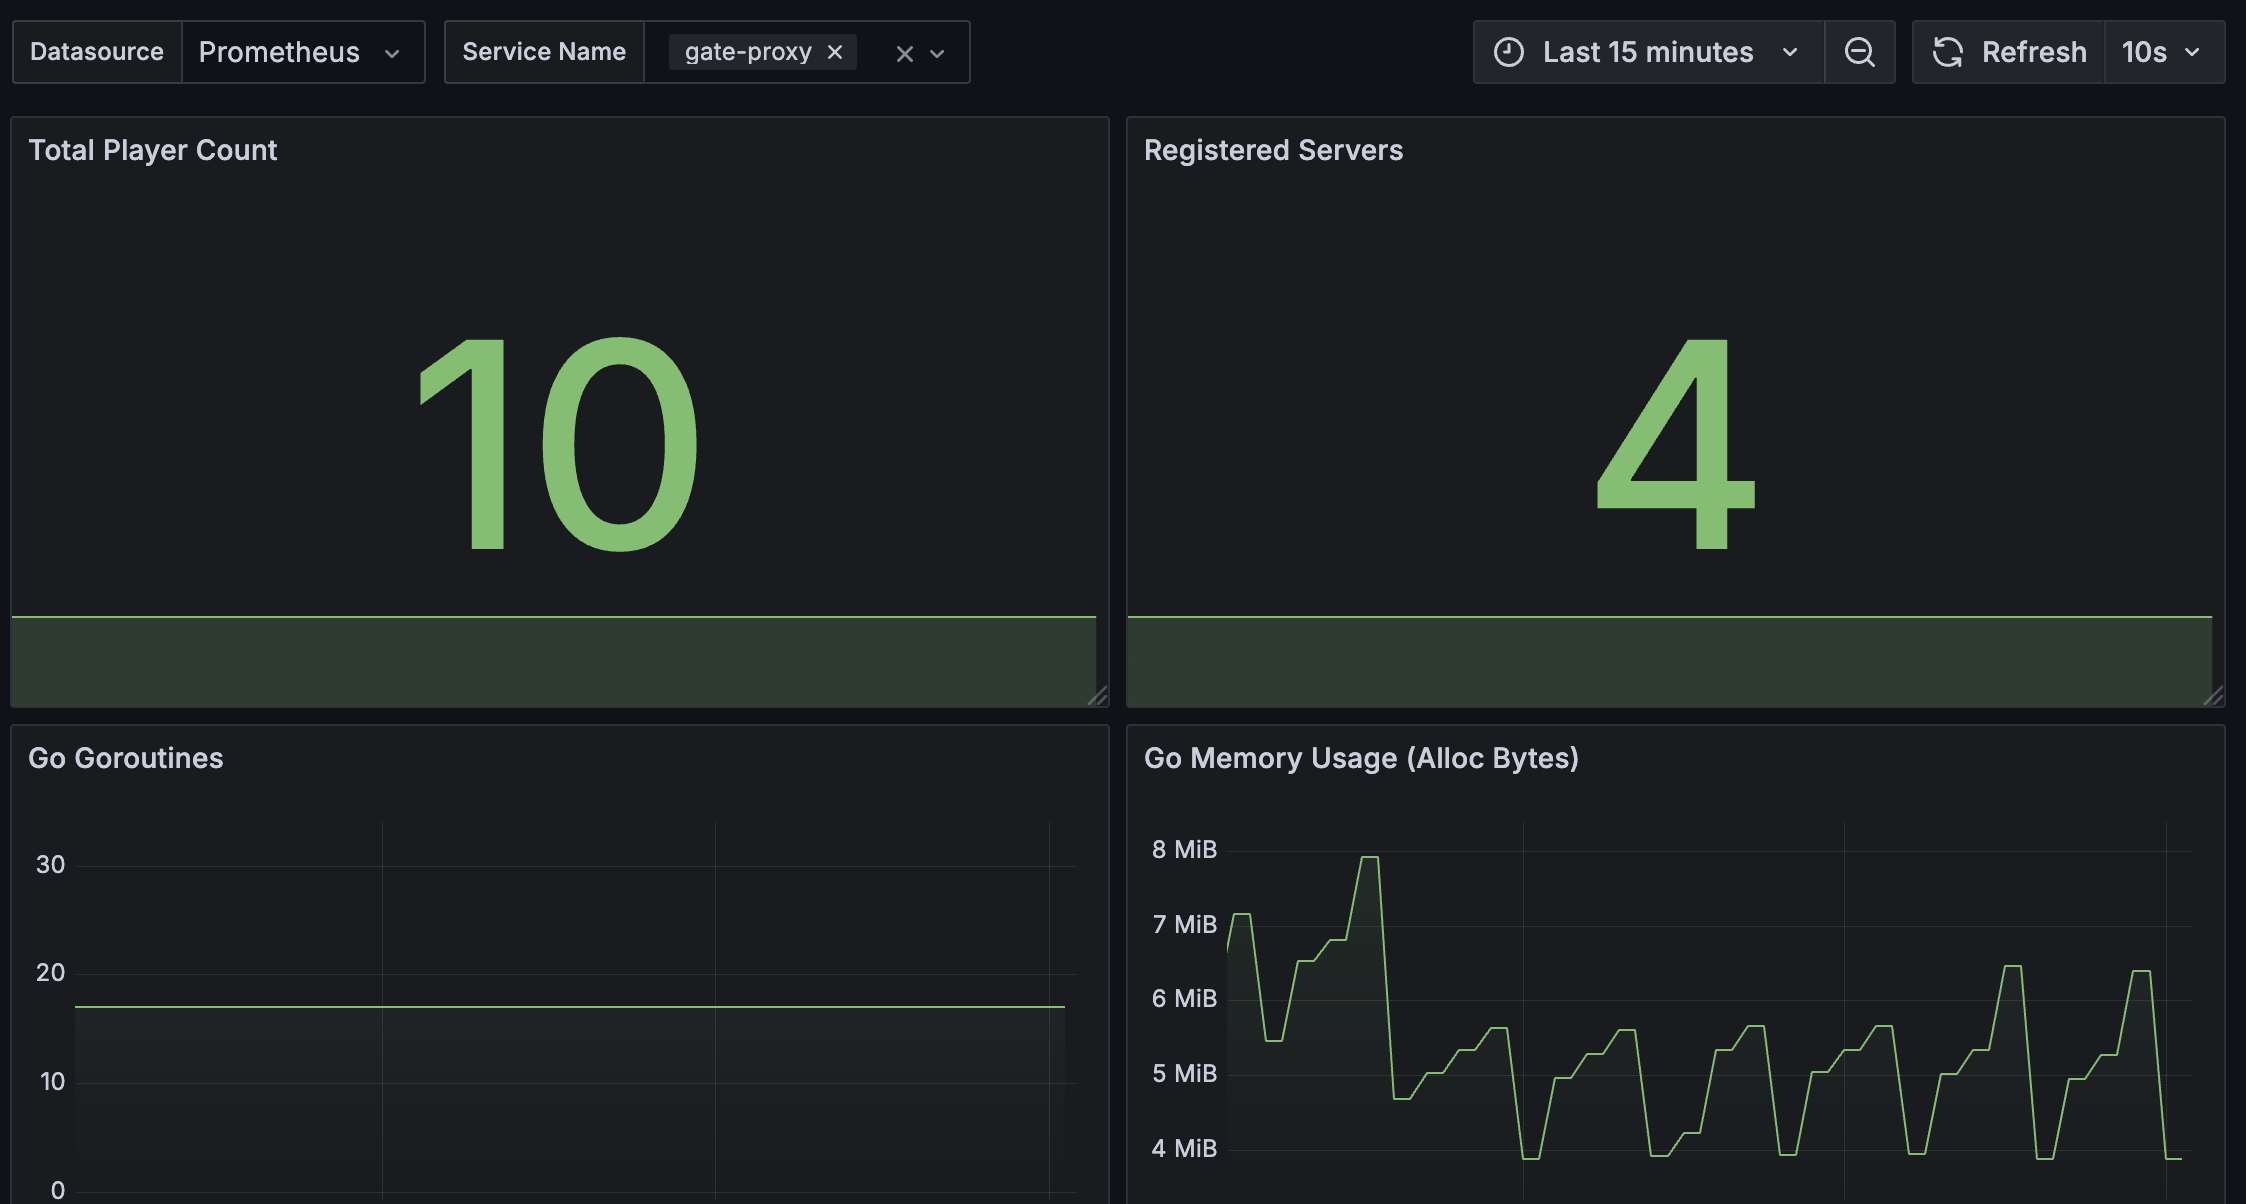
Dashboard Features:
- Total Player Count (
proxy_player_count) - Gate Instance Status (
up) - Go Goroutines (
go_goroutines) - Go Memory Usage (
go_memstats_alloc_bytes)
Get the Dashboard JSON:
- Download Raw JSON: Download Dashboard JSON
- View on GitHub: gate-overview-dashboard.json
If you have cloned the repository, you can also find the dashboard at .web/docs/guide/otel/self-hosted/grafana-dashboards/gate-overview-dashboard.json within your local copy.
Importing the Dashboard:
- Navigate to your Grafana instance (usually http://localhost:3000).
- Log in (default: admin/admin, then change the password).
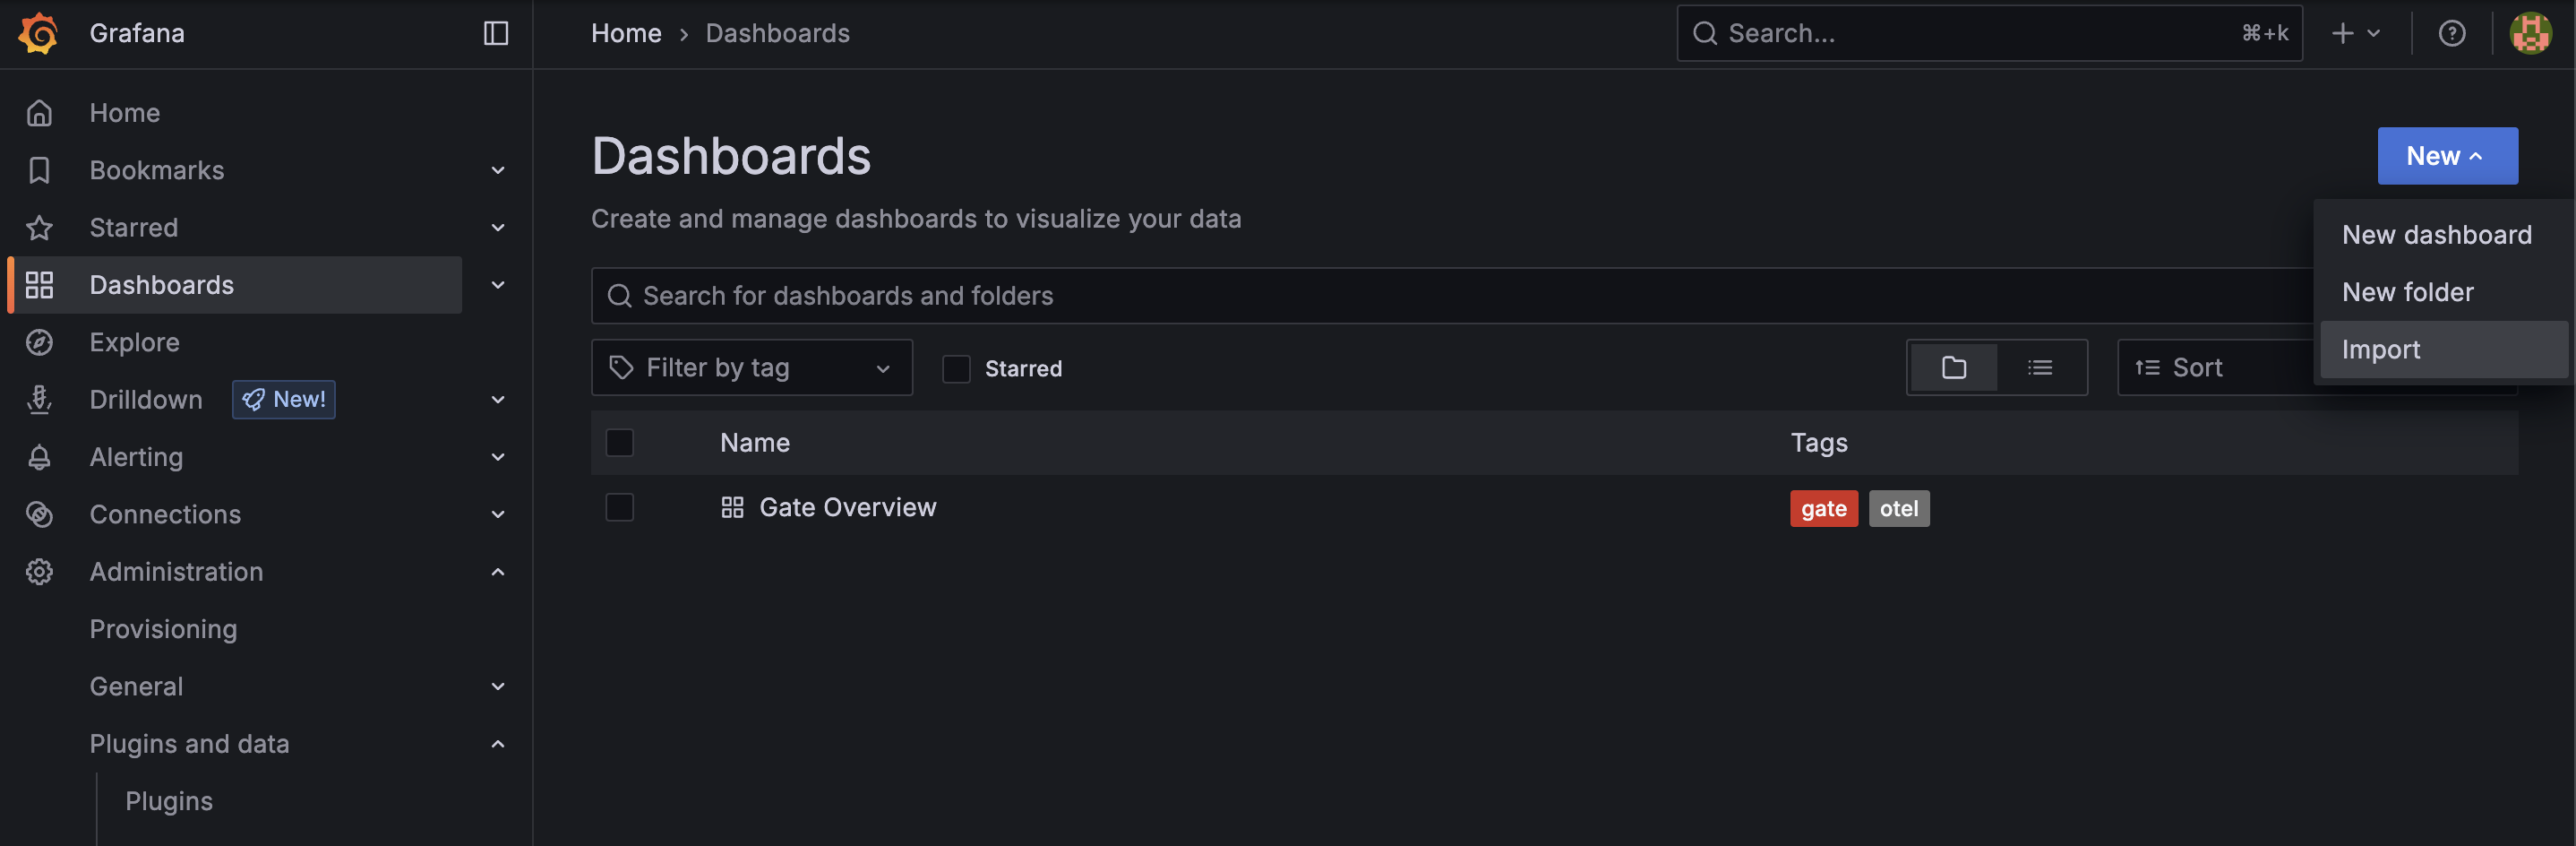
- On the left-hand menu, go to Dashboards.
- On the Dashboards page, click the "New" button in the top right and select "Import".
- Click the "Upload JSON file" button and select the
gate-overview-dashboard.jsonfile you downloaded, or paste the JSON content directly into the text area. - On the next screen, you can change the dashboard name if desired.
- Important: Select your Prometheus data source from the dropdown (usually named "Prometheus").
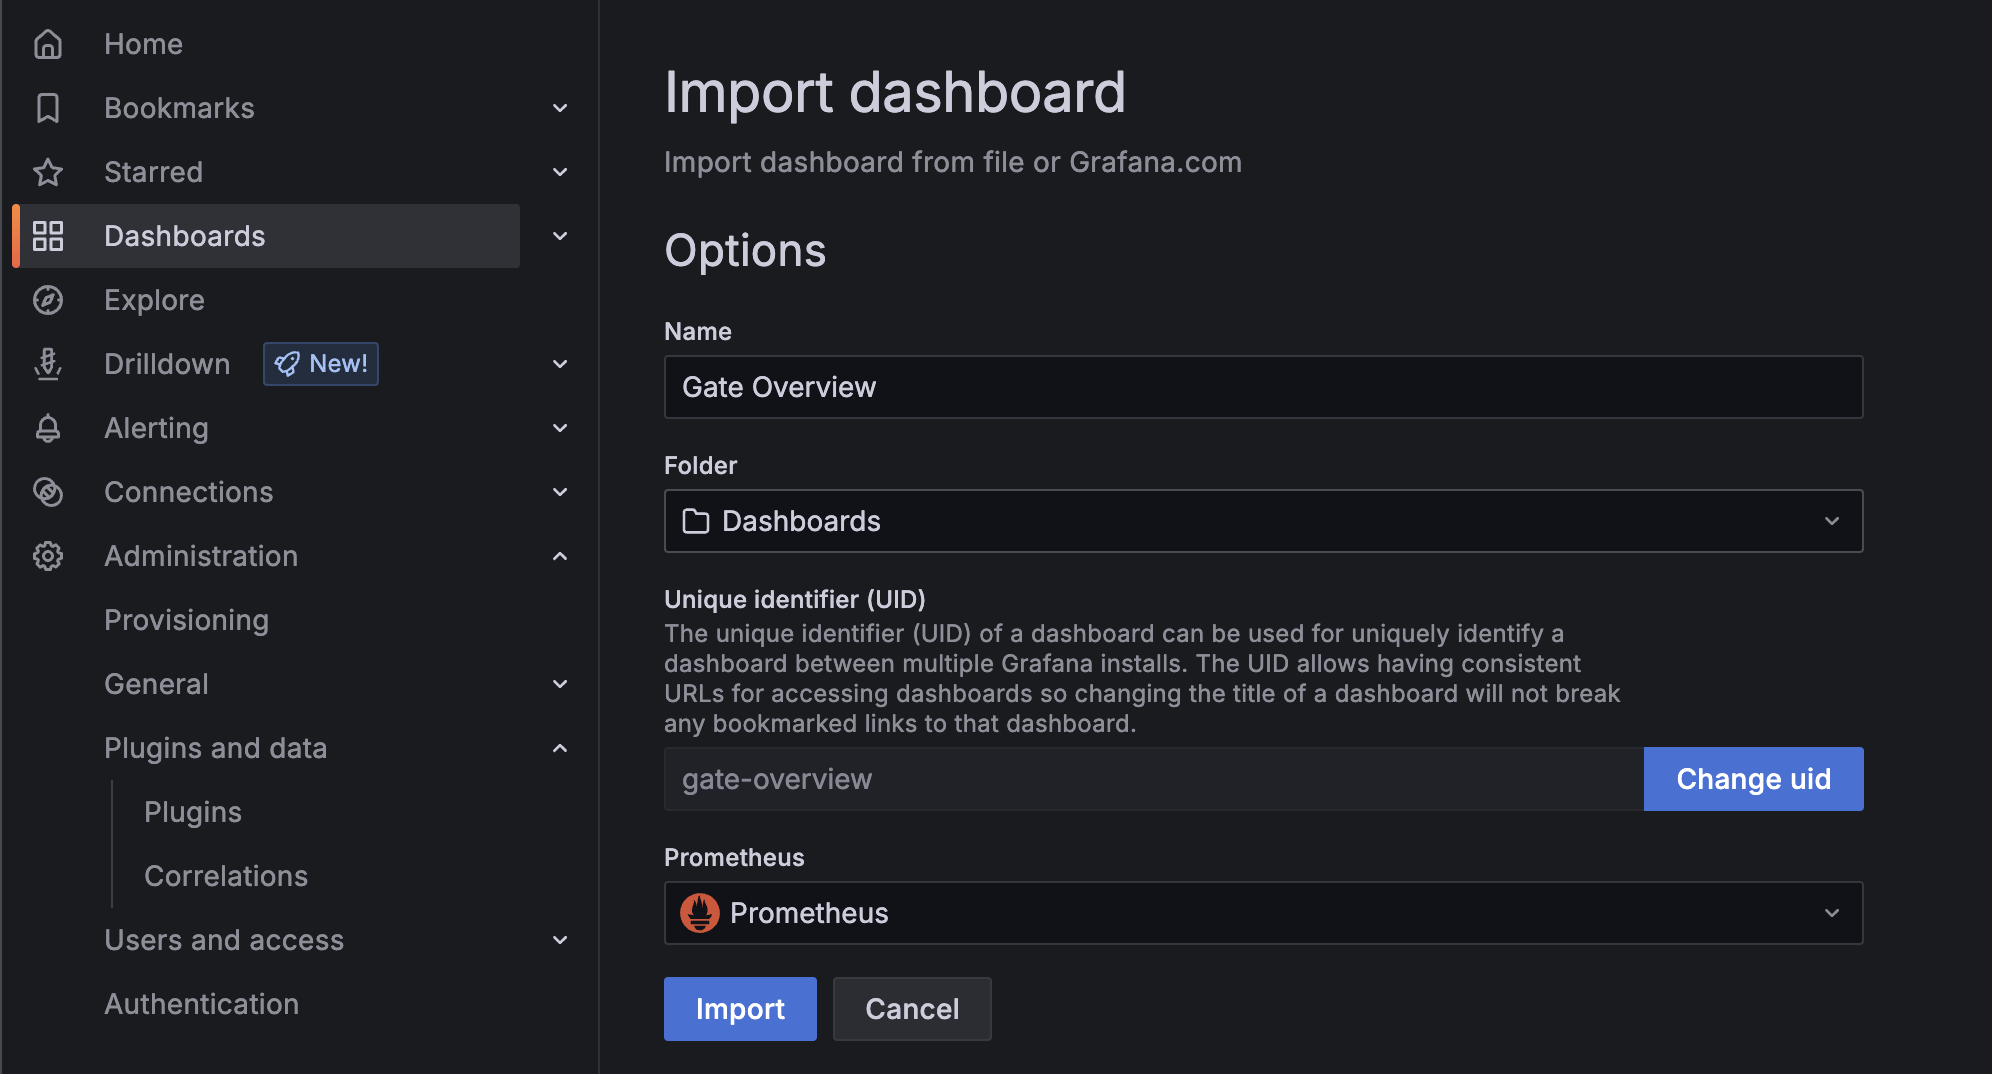
- Click "Import".
You should now see the "Gate Overview" dashboard with panels visualizing metrics from your Gate instance(s).