Self-Hosted Grafana, Prometheus & Tempo Stack
This guide provides instructions on how to set up a self-hosted Grafana, Prometheus, and Tempo stack using Docker Compose and configure Gate to send telemetry data (traces and metrics) to this stack.
Quick Start: Get the Configs
To get the configuration files for this scenario:
- Clone the repository (if you haven't already):
bashgit clone https://github.com/minekube/gate.git- Navigate to the directory for this scenario:
bash(Adjust thecd gate/.web/docs/guide/otel/self-hosted/otel-stack-configscdpath if you cloned into a different parent directory or are already inside thegaterepo directory, e.g.,cd .web/docs/guide/otel/self-hosted/otel-stack-configs)
This setup uses Grafana Tempo for traces, Prometheus for metrics, and Grafana for visualizing both. Gate will send traces directly to Tempo via OTLP. Metrics are also sent via OTLP using OTEL_METRICS_ENABLED="true".
1. Configuration Files
You'll need the following configuration files. The docker-compose.yml below assumes these configuration files are in the same directory when you run docker compose up -d from within the otel-stack-configs directory (after navigating into it as shown in the Quick Start). The default setup uses a "push" model where the OpenTelemetry Collector sends metrics to Prometheus.
version: '3.8'

services:
  # Tempo runs as user 10001, and docker compose creates the volume as root.
  # As such, we need to chown the volume in order for Tempo to start correctly.
  init-tempo:
    image: &tempoImage grafana/tempo:latest
    user: root
    entrypoint:
      - 'chown'
      - '-R' # Ensure recursive
      - '10001:10001'
      - '/var/tempo'
    volumes:
      - tempo_data:/var/tempo

  # OpenTelemetry Collector to receive traces and metrics
  otel-collector:
    image: otel/opentelemetry-collector-contrib:latest
    container_name: otel-collector
    # Default command uses the 'push' configuration (collector pushes to Prometheus remote_write)
    command: ['--config=/etc/otel-collector-config-push.yaml']
    # To use 'pull' configuration (Prometheus scrapes collector):
    # command: ['--config=/etc/otel-collector-config-pull.yaml']
    volumes:
      # Mount both configurations, default command points to the 'push' version.
      - ./otel-collector-config-pull.yaml:/etc/otel-collector-config-pull.yaml
      - ./otel-collector-config-push.yaml:/etc/otel-collector-config-push.yaml
      # Ensure the mounted config in 'command' matches one of the above.
    ports:
      - '4317:4317' # OTLP gRPC
      - '4318:4318' # OTLP HTTP
      - '8889:8889' # Prometheus metrics exporter
    networks:
      - otel-stack
    depends_on:
      - tempo
      - prometheus

  prometheus:
    image: prom/prometheus:v3.13.0
    container_name: prometheus
    command:
      # Default uses 'push' config (collector pushes to Prometheus remote_write)
      - '--config.file=/etc/prometheus/prometheus-config-push.yml'
      - '--web.enable-lifecycle' # Allows hot-reloading of the config
      - '--web.enable-remote-write-receiver' # Required for 'push' model
      # For 'pull' config (Prometheus scrapes collector):
      # - '--config.file=/etc/prometheus/prometheus-config-pull.yml'
      # (and remove '--web.enable-remote-write-receiver' if not needed otherwise)
    volumes:
      # Mount both configurations, default command points to the 'push' version.
      - ./prometheus-config-pull.yml:/etc/prometheus/prometheus-config-pull.yml:ro
      - ./prometheus-config-push.yml:/etc/prometheus/prometheus-config-push.yml:ro
      # Ensure the mounted config in 'command' (--config.file=) matches one of the above.
      - prometheus_data:/prometheus
    ports:
      - '9090:9090'
    networks:
      - otel-stack

  tempo:
    image: *tempoImage
    container_name: tempo
    command: ['-config.file=/etc/tempo.yaml']
    volumes:
      - ./tempo.yaml:/etc/tempo.yaml:ro
      - tempo_data:/var/tempo # Use named volume, initialized by init-tempo
    ports:
      - '3200:3200' # Tempo UI
      - '9095:9095' # Tempo gRPC internal
    depends_on:
      init-tempo: # Depends on the init container
        condition: service_completed_successfully
      prometheus:
        condition: service_started
    networks:
      - otel-stack

  grafana:
    image: grafana/grafana:12.4.5
    container_name: grafana
    environment:
      - GF_AUTH_ANONYMOUS_ENABLED=true
      - GF_AUTH_ANONYMOUS_ORG_ROLE=Admin
      - GF_AUTH_DISABLE_LOGIN_FORM=true
      - GF_FEATURE_TOGGLES_ENABLE=traceqlEditor metricsSummary
      - GF_INSTALL_PLUGINS=https://storage.googleapis.com/integration-artifacts/grafana-exploretraces-app/grafana-exploretraces-app-latest.zip;grafana-traces-app
    volumes:
      - ./grafana-datasources.yml:/etc/grafana/provisioning/datasources/datasources.yml:ro
      - grafana_data:/var/lib/grafana
    ports:
      - '3000:3000'
    depends_on:
      - prometheus
      - tempo
    networks:
      - otel-stack

networks:
  otel-stack:
    driver: bridge

volumes:
  prometheus_data:
  tempo_data:
grafana_data:receivers:
otlp: # Receives OTLP data (traces and metrics) from Gate
protocols:
grpc:
endpoint: 0.0.0.0:4317
http:
endpoint: 0.0.0.0:4318
processors:
batch:
send_batch_size: 10000
timeout: 10s
memory_limiter:
check_interval: 1s
limit_mib: 1000
spike_limit_mib: 200
exporters:
otlp: # For traces to Tempo
endpoint: tempo:4317 # Tempo's OTLP gRPC endpoint
tls:
insecure: true
prometheusremotewrite:
endpoint: 'http://prometheus:9090/api/v1/write' # Prometheus remote_write endpoint
tls:
insecure: true # Assuming HTTP for local setup
service:
pipelines:
traces:
receivers: [otlp]
processors: [memory_limiter, batch]
exporters: [otlp]
metrics:
receivers: [otlp]
processors: [memory_limiter, batch]
exporters: [prometheusremotewrite]global:
scrape_interval: 15s
# The remote write receiver is enabled via the --web.enable-remote-write-receiver command-line flag.
# No specific configuration for it is needed in this file if only that flag is used.
scrape_configs:
- job_name: 'prometheus' # Scrapes Prometheus itself
static_configs:
- targets: ['localhost:9090']
# No need to scrape otel-collector directly for metrics pushed to remote_write
# However, you might keep other scrape jobs or a job for the collector's own metrics if needed.
# For this example, we focus on metrics coming via remote_write.
# If the collector also exposes its internal metrics (e.g. on :8888/metrics by default),
# you could add a job for that:
# - job_name: 'otel-collector-internal'
# static_configs:
# - targets: ['otel-collector:8888'] # Default port for collector's own metricsserver:
http_listen_port: 3200
distributor:
receivers:
otlp:
protocols:
grpc:
endpoint: 0.0.0.0:4317
http:
endpoint: 0.0.0.0:4318
zipkin: {}
jaeger:
protocols:
grpc:
endpoint: 0.0.0.0:14268
ingester:
trace_idle_period: 10s # How long to wait for more spans in a trace
storage:
trace:
backend: local # Use local filesystem for storage
local:
path: /tmp/tempo/blocks
metrics_generator:
storage:
path: /tmp/tempo/generator/wal
remote_write:
- url: http://prometheus:9090/api/v1/write
send_exemplars: true
compactor:
compaction:
compaction_window: 1h # Compact data older than this
block_retention: 1h # Overall retention for blocks
# This is an optional section, if you want Tempo to also expose its own metrics
# to be scraped by Prometheus. This is separate from the metrics_generator above.
# self_monitor:
# tempo_service_name: tempo
# prometheus_http_path: /metrics
# prometheus_http_port: 3200 # Can be the same as server.http_listen_port
# Traces can also be received directly by the ingester if needed, but distributor is common.
# ingester:
# lifecycler:
# ring:
# kvstore:
# store: memberlist
# replication_factor: 1
# final_sleep: 0s
# max_block_bytes: 1_000_000
# max_block_duration: 5m
# Search configuration (optional, defaults are usually fine for local)
# search:
# backend: lucene
# lucene:
# path: /tmp/tempo/search
# mem_gb: 1
# Overrides default configuration for some aspects
# overrides:
# defaults:
# metrics_generator_processors:
# - service-graphs
# - span-metrics
# This is an example configuration, refer to Tempo documentation for more options
# https://grafana.com/docs/tempo/latest/configuration/apiVersion: 1
datasources:
- name: Prometheus
type: prometheus
access: proxy
url: http://prometheus:9090
isDefault: true
jsonData:
exemplarTraceIdDestinations:
- datasourceUid: tempo
name: traceID
- name: Tempo
type: tempo
access: proxy
url: http://tempo:3200
uid: tempo # Explicit UID for linking from Prometheus
jsonData:
serviceMap:
datasourceUid: Prometheus # Query service map data from Prometheus
tracesToMetrics:
datasourceUid: 'prometheus'
tags: [{ key: 'service.name' }, { key: 'job' }]
queries:
- name: 'Example Query: Rate of requests'
query: 'sum(rate(traces_spanmetrics_latency_count{$$__tags}[5m])) by ($$__labels)'
search:
hide: false # Show the search tab by default
nodeGraph:
enabled: trueThe OpenTelemetry Collector first receives telemetry data (traces and metrics) from Gate via OTLP. Its configuration for handling and forwarding this data, particularly metrics to Prometheus, is detailed below. The default "push" vs. alternative "pull" options refer to how metrics are sent from the Collector to Prometheus. Refer to the comments within the main docker-compose.yml (included above) for instructions on how to set up the otel-collector and prometheus services for each approach.
# Collector receives from Gate (via OTLP receiver, see config) and then pushes metrics to Prometheus's remote_write endpoint.
# (This is the default setup shown in the main docker-compose.yml)
# otel-collector service in docker-compose.yml should use:
# command: ['--config=/etc/otel-collector-config-push.yaml']
# Prometheus service in docker-compose.yml should mount:
# - ./otel-stack-configs/prometheus-config-push.yml:/etc/prometheus/prometheus.yml
# And Prometheus service command in docker-compose.yml should include:
# - '--web.enable-remote-write-receiver'
receivers:
  otlp: # Receives OTLP data (traces and metrics) from Gate
    protocols:
      grpc:
        endpoint: 0.0.0.0:4317
      http:
        endpoint: 0.0.0.0:4318

processors:
  batch:
    send_batch_size: 10000
    timeout: 10s
  memory_limiter:
    check_interval: 1s
    limit_mib: 1000
    spike_limit_mib: 200

exporters:
  otlp: # For traces to Tempo
    endpoint: tempo:4317 # Tempo's OTLP gRPC endpoint
    tls:
      insecure: true
  prometheusremotewrite:
    endpoint: 'http://prometheus:9090/api/v1/write' # Prometheus remote_write endpoint
    tls:
      insecure: true # Assuming HTTP for local setup

service:
  pipelines:
    traces:
      receivers: [otlp]
      processors: [memory_limiter, batch]
      exporters: [otlp]
    metrics:
      receivers: [otlp]
      processors: [memory_limiter, batch]
exporters: [prometheusremotewrite]# Corresponding Prometheus config (enables remote_write receiver)
# Ensure Prometheus service in docker-compose.yml has the flag:
# command:
# - '--config.file=/etc/prometheus/prometheus-config-push.yml'
# - '--web.enable-lifecycle'
# - '--web.enable-remote-write-receiver' # <--- This flag is active by default
global:
  scrape_interval: 15s

# The remote write receiver is enabled via the --web.enable-remote-write-receiver command-line flag.
# No specific configuration for it is needed in this file if only that flag is used.

scrape_configs:
  - job_name: 'prometheus' # Scrapes Prometheus itself
    static_configs:
      - targets: ['localhost:9090']

  # No need to scrape otel-collector directly for metrics pushed to remote_write
  # However, you might keep other scrape jobs or a job for the collector's own metrics if needed.
  # For this example, we focus on metrics coming via remote_write.
  # If the collector also exposes its internal metrics (e.g. on :8888/metrics by default),
  # you could add a job for that:
  # - job_name: 'otel-collector-internal'
  #   static_configs:
# - targets: ['otel-collector:8888'] # Default port for collector's own metrics# ALTERNATIVE: Collector receives from Gate (via OTLP receiver, see config) and exposes metrics on :8889. Prometheus then scrapes (pulls) from the collector.
# To use this, modify docker-compose.yml:
# otel-collector service command: ['--config=/etc/otel-collector-config-pull.yaml']
# Prometheus service command: use '--config.file=/etc/prometheus/prometheus-config-pull.yml' (and consider removing --web.enable-remote-write-receiver if not needed for other purposes)
receivers:
otlp: # Receives OTLP data (traces and metrics) from Gate
protocols:
grpc:
endpoint: 0.0.0.0:4317
http:
endpoint: 0.0.0.0:4318
processors:
batch:
# Recommended batch settings for production
send_batch_size: 10000
timeout: 10s
memory_limiter:
check_interval: 1s
limit_mib: 1000
spike_limit_mib: 200
exporters:
otlp:
endpoint: tempo:4317
tls:
insecure: true
prometheus:
endpoint: 0.0.0.0:8889
send_timestamps: true
metric_expiration: 180m
resource_to_telemetry_conversion:
enabled: true
service:
pipelines:
traces:
receivers: [otlp]
processors: [memory_limiter, batch]
exporters: [otlp]
metrics:
receivers: [otlp]
processors: [memory_limiter, batch]
exporters: [prometheus]# Corresponding Prometheus config for pull (scrapes otel-collector:8889)
global:
scrape_interval: 15s
scrape_configs:
- job_name: 'prometheus'
static_configs:
- targets: ['localhost:9090']
- job_name: 'otel-collector'
scrape_interval: 10s
static_configs:
- targets: ['otel-collector:8889'] # This is scraped by Prometheus
metric_relabel_configs:
# Convert duration_seconds to latency for Tempo compatibility
- source_labels: [__name__]
regex: 'traces_spanmetrics_duration_seconds(_bucket|_sum|_count)?'
target_label: __name__
replacement: 'traces_spanmetrics_latency${1}'2. Configure Gate Environment Variables
To send telemetry data from Gate to this self-hosted stack:
For Traces and Metrics (to OpenTelemetry Collector via OTLP/HTTP):
export OTEL_EXPORTER_OTLP_ENDPOINT="http://localhost:4318" # Or IP of Docker host if Gate is external
export OTEL_EXPORTER_OTLP_PROTOCOL="http/protobuf"
export OTEL_TRACES_ENABLED="true"
export OTEL_METRICS_ENABLED="true" # Ensure metrics are enabled to be sent via OTLP
# OTEL_SERVICE_NAME is recommended, e.g., "gate-proxy"
Note on Insecure Connection: Since the
OTEL_EXPORTER_OTLP_ENDPOINTis set to anhttp://address (e.g.,http://localhost:4318) andOTEL_EXPORTER_OTLP_PROTOCOLishttp/protobuf, the connection to the OTLP receiver (OpenTelemetry Collector in this case) will be insecure (not using TLS). This is typically handled automatically by the OTel SDK when anhttp://scheme is used with an HTTP-based protocol. For self-hosted setups like this one, especially in local development, using an insecure connection is common. In production environments, always prefer securehttps://endpoints and appropriate authentication mechanisms.
If Gate is running as a Docker container itself on the same Docker network (otel-stack), you can use the service name:
export OTEL_EXPORTER_OTLP_ENDPOINT="http://otel-collector:4318"3. Running the Stack
Save all the configuration files (
docker-compose.yml,prometheus-config-push.yml,tempo.yaml,grafana-datasources.yml, andotel-collector-config-push.yaml) in theotel-stack-configsdirectory (if you haven't already from the Quick Start steps).Open a terminal, navigate into the
otel-stack-configsdirectory, and run:bashdocker compose up -dAccess Services: Once the stack is running, you can access the UIs for the different services:
Service URL Default Credentials Grafana http://localhost:3000 admin/adminPrometheus http://localhost:9090 N/A Tempo http://localhost:3200 N/A (UI via Grafana is primary) For Grafana, you will be prompted to change the password after the first login.
4. Understanding the Stack Architecture
This setup uses the following components:
- OpenTelemetry Collector: Receives traces and metrics from Gate via OTLP, processes them, and forwards traces to Tempo and exposes metrics for Prometheus to scrape.
- Tempo: Stores and indexes traces for efficient querying.
- Prometheus: Scrapes and stores metrics from the OpenTelemetry Collector.
- Grafana: Provides visualization for both traces and metrics, with correlation between them.
The data flow is as follows:
- Gate sends both traces and metrics to the OpenTelemetry Collector via OTLP.
- The collector forwards traces to Tempo for storage.
- The collector exposes metrics on port 8889, which Prometheus scrapes.
- Grafana queries both Tempo and Prometheus to provide a unified view of your telemetry data.
This architecture allows for:
- Efficient collection and processing of telemetry data
- Correlation between traces and metrics
- Service graphs and span metrics for better visualization
- Scalability as your observability needs grow
5. Viewing Data in Grafana
- Prometheus:
- The Prometheus data source should be automatically provisioned.
- Go to "Explore", select "Prometheus", and you can query metrics like
prometheus_http_requests_total. To view Gate metrics, you'd first need to set up an OpenTelemetry Collector to receive OTLP metrics from Gate and expose them to Prometheus.
- Tempo:
- The Tempo data source should also be automatically provisioned.
- Go to "Explore", select "Tempo". You can search for traces by Service Name (e.g., your
OTEL_SERVICE_NAMEfor Gate), or look at the Service Graph (ifmetrics_generatorin Tempo is working correctly and sending data to Prometheus). - If you have metrics that can be correlated with traces (like exemplars), you might be able to jump from metrics in Prometheus to traces in Tempo.
6. Sample Gate Dashboard
We provide a sample Grafana dashboard to help you get started with visualizing Gate's metrics.
You are expected to make your own dashboard, this is just a starting point.
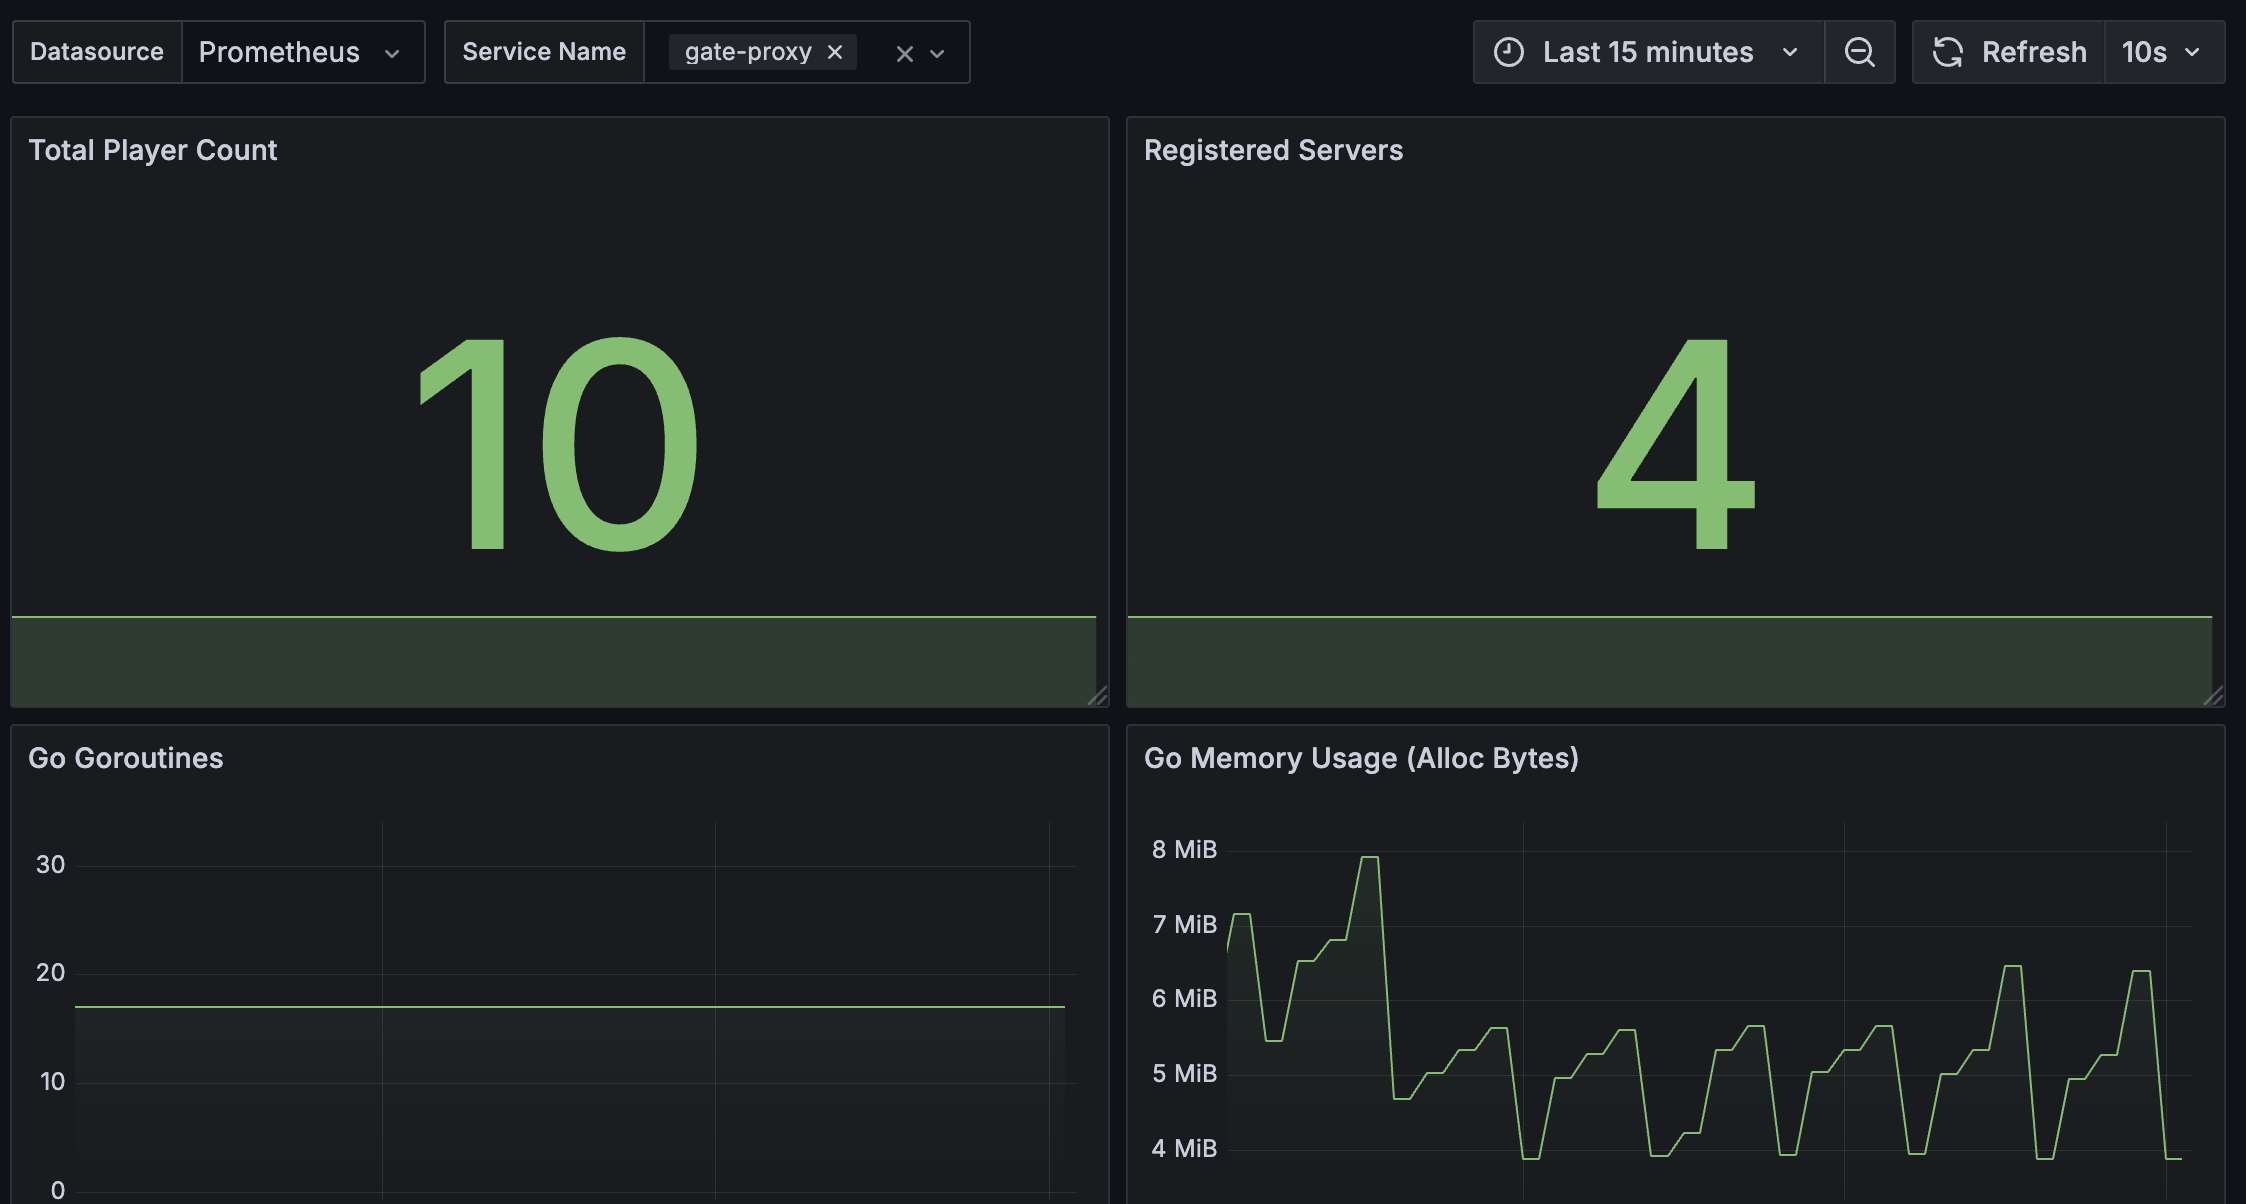
Dashboard Features:
- Total Player Count (
proxy_player_count) - Gate Instance Status (
up) - Go Goroutines (
go_goroutines) - Go Memory Usage (
go_memstats_alloc_bytes)
Get the Dashboard JSON:
- Download Raw JSON: Download Dashboard JSON
- View on GitHub: gate-overview-dashboard.json
If you have cloned the repository, you can also find the dashboard at .web/docs/guide/otel/self-hosted/grafana-dashboards/gate-overview-dashboard.json within your local copy.
Importing the Dashboard:
- Navigate to your Grafana instance (usually http://localhost:3000).
- Log in (default: admin/admin, then change the password).
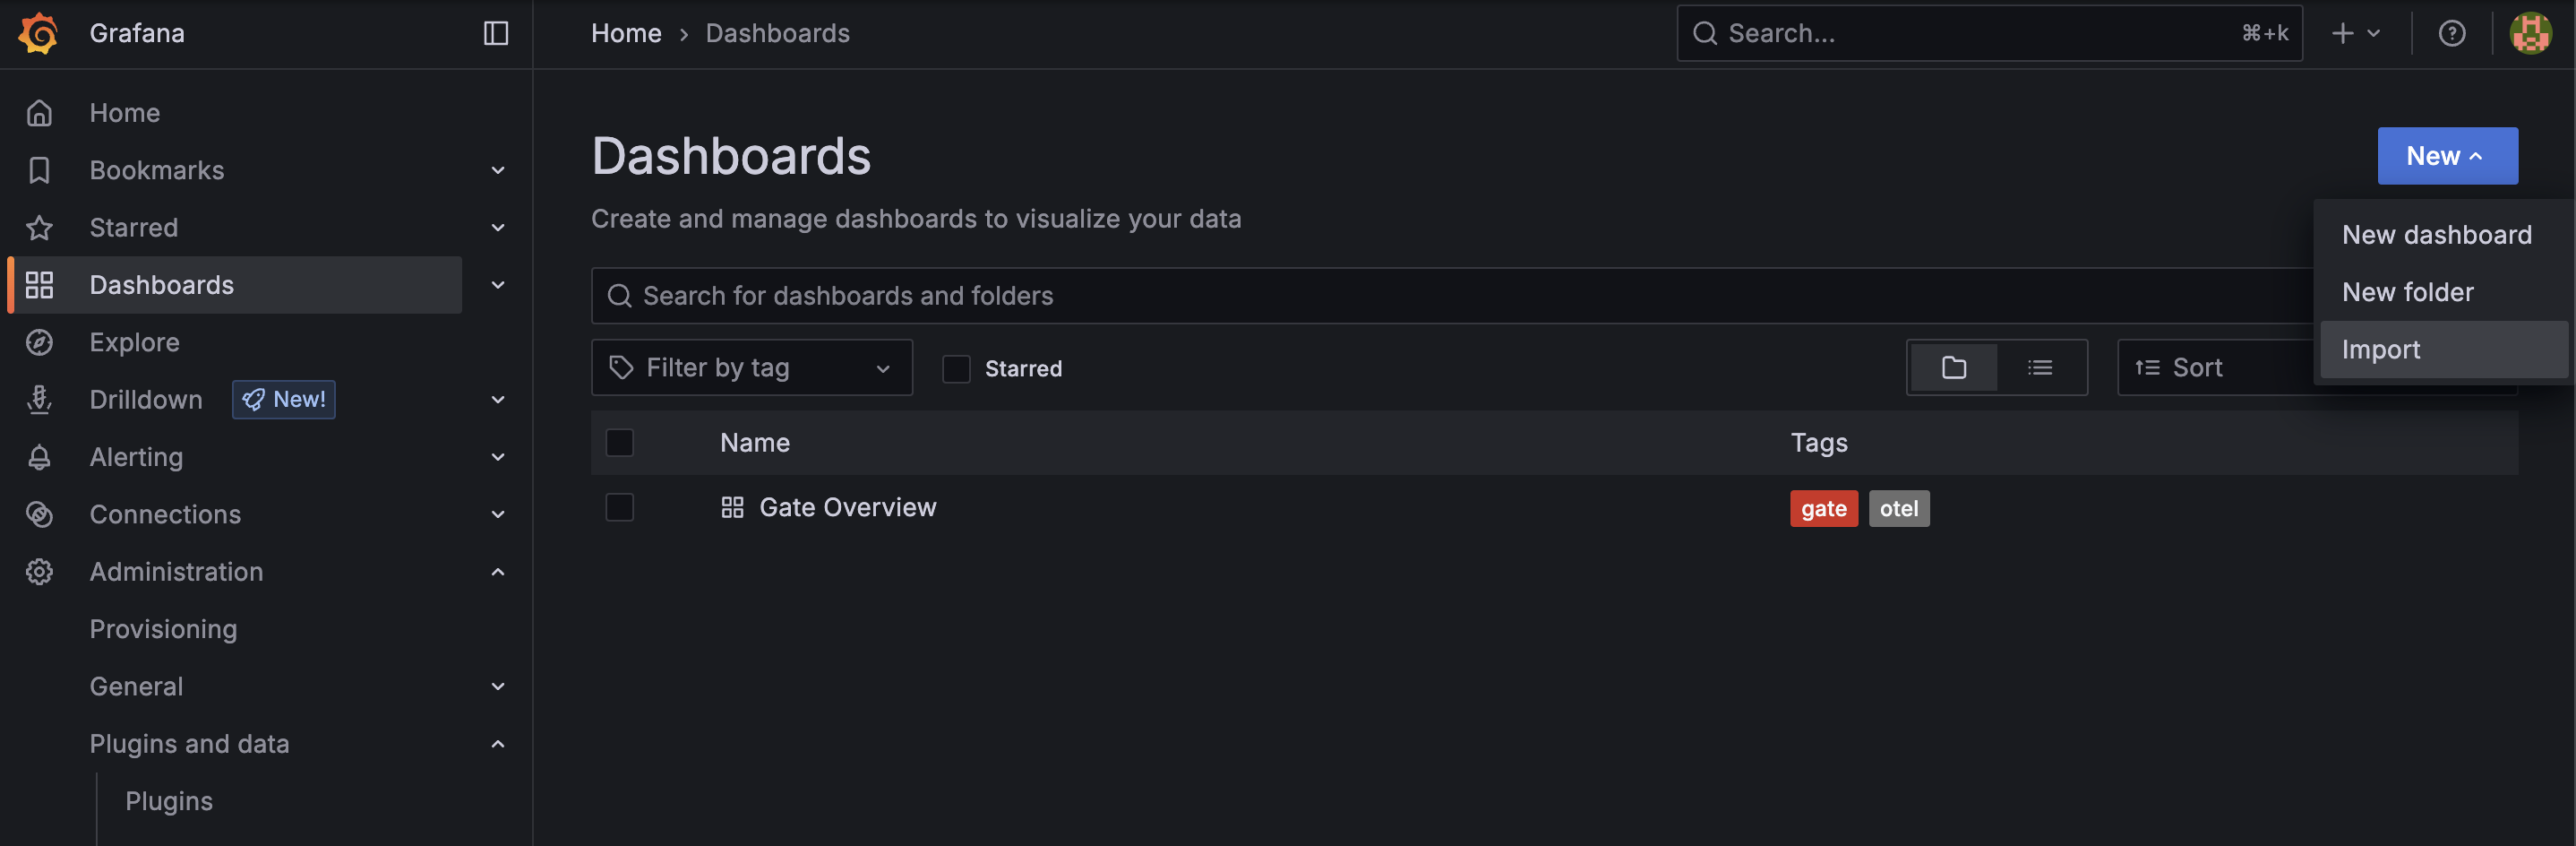
- On the left-hand menu, go to Dashboards.
- On the Dashboards page, click the "New" button in the top right and select "Import".
- Click the "Upload JSON file" button and select the
gate-overview-dashboard.jsonfile you downloaded, or paste the JSON content directly into the text area. - On the next screen, you can change the dashboard name if desired.
- Important: Select your Prometheus data source from the dropdown (usually named "Prometheus").
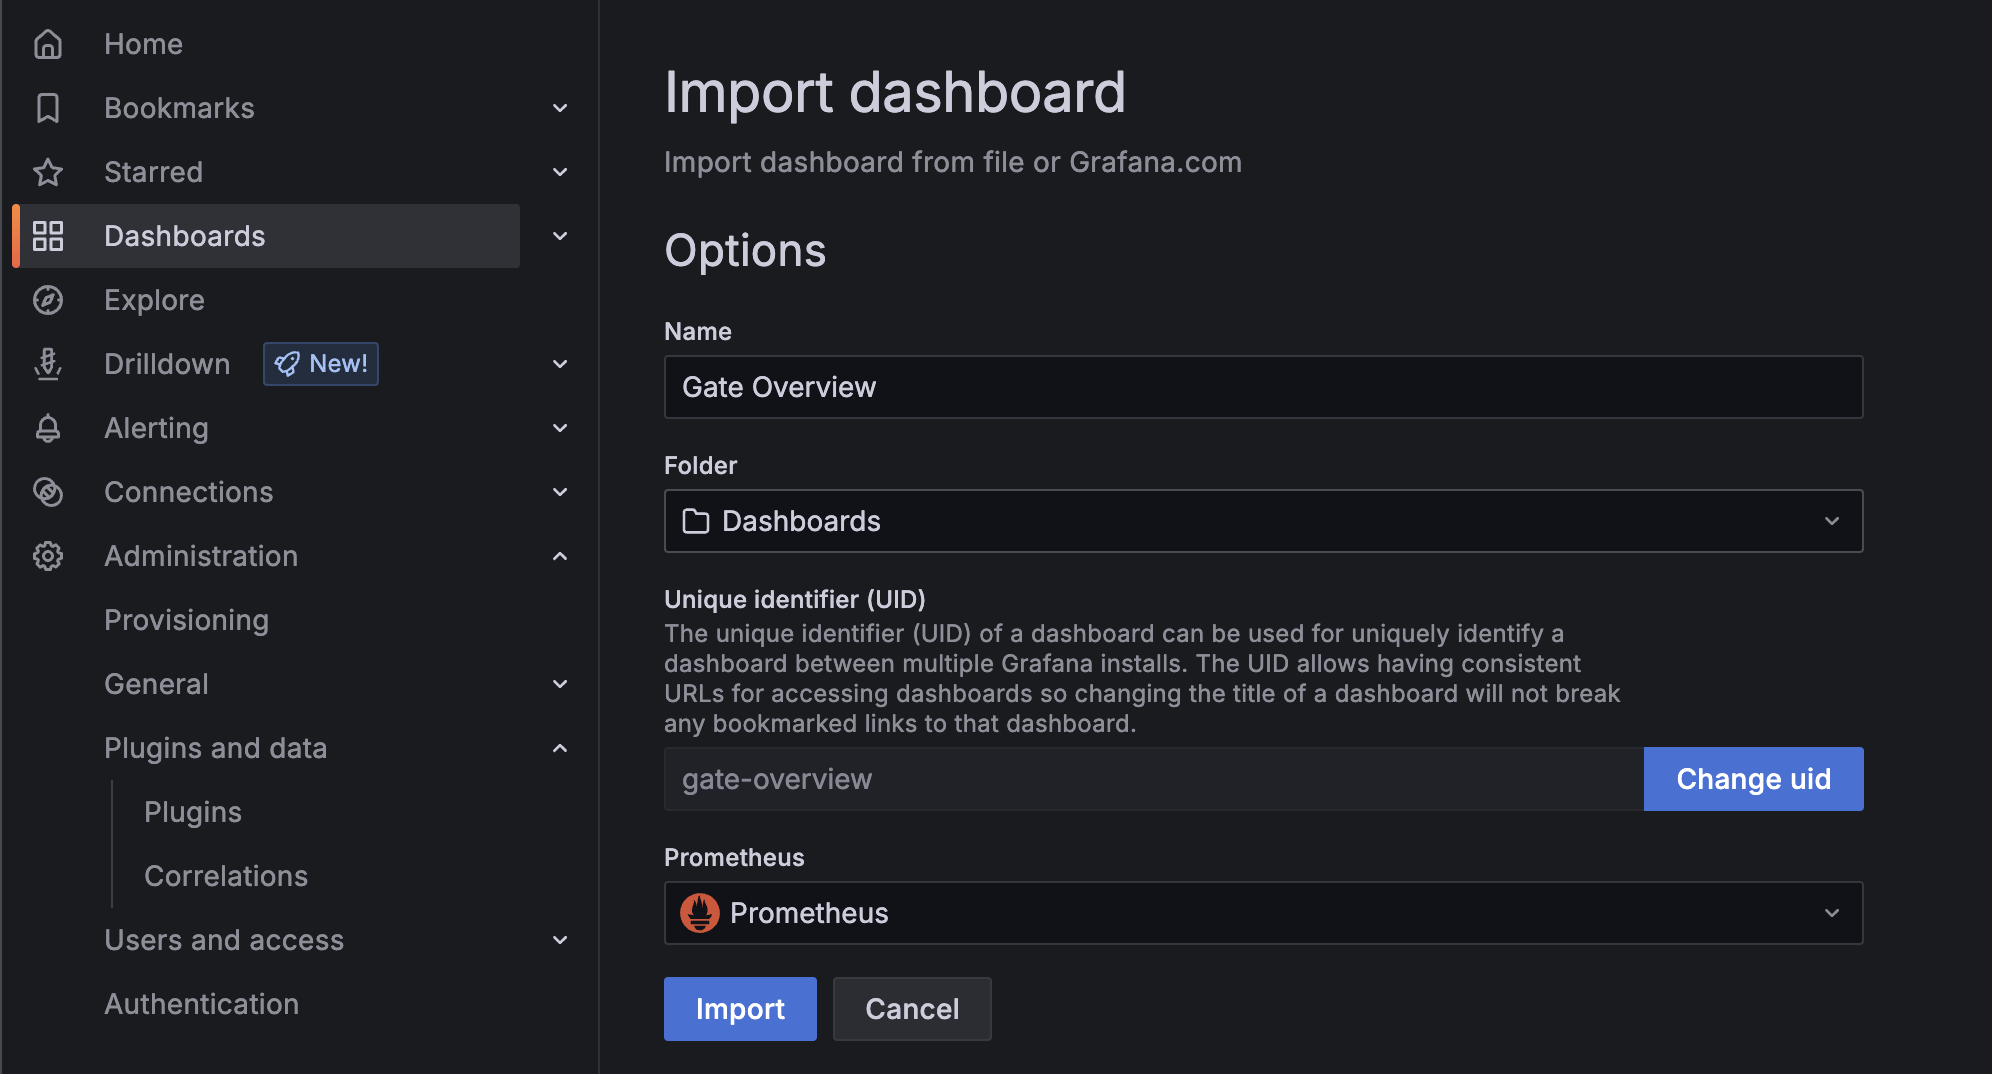
- Click "Import".
You should now see the "Gate Overview" dashboard with panels visualizing metrics from your Gate instance(s).